A Just Transition Plan for Australia’s Bowen Basin coal industry

Queensland’s Bowen Basin hosts the biggest coal industry in the world, and the biggest pipeline of renewable energy power stations in the world. By transitioning one into the other, Australia can deliver a monster benefit to our economy, our community, and our climate. Win-win-win. How to maximise the value add? Do it now.

This Report delivers a comprehensive plan for this transition; justly to minimise job disruption, and to maximise the community benefit – economic and social.

Map of central Queensland showing the 46 coalmines and 4 coal-fired power stations of the Bowen Basin, and the renewable pipeline of 68 operating, planned or funded renewable power stations plus 8 battery metal projects also planned and most funded. The net operating jobs are 6720 coal jobs lost and 5545 renewable jobs gained.

The Just Transition Plan will establish the Bowen Basin Transition Authority (BBTA) to manage this inventory of jobs lost and jobs gained, by honest-brokering the employing stakeholders, and simultaneously drawing together the community stakeholders into an ongoing collaboration of all parties.

New understandings of Antarctica: sealevel rise will accelerate, in a stepped trajectory, unpredictably, and soon

In the current climate heating event, sealevel rise, unlike atmospheric temperature, is an indirect effect. Sealevel rise is the effect of a plethora of causes. These twin factors complicate, and make more uncertain, the prediction of sealevel rise. Since global heating began in the 20th century, in contrast with atmospheric temperature rise, sealevel rise, while constant, has been restricted to less than 0.1 metre. This “nothing to see here” situation, despite the rate being geologically rapid, has lulled the world into a false sense of security. New understandings of Antarctica in the past five years tell us that sealevel rise will most likely accelerate, in a stepped trajectory, unpredictably, and possibly soon. Catastrophic collapse of parts of West Antarctica, and sealevel rise of several metres in the next century are quite likely.

These major fractures are the next generation of icecap cliffs. They may presage one (or two) tipping points: (1) Being over 100 metres high they may be in a tensile fracturing regime of self-perpetuating calving: Marine Ice Cliff Instability (MICI). (2) They may also
be in the critical grounding zone of land icecap and conjoined sea icecap underlain by shallow seafloor, in unstable equlibrium creating self-sustaining melting: Marine Ice Sheet Instability (MISI). This critical topology is invisible to researchers except via geophysics.

Kids’ Spoiler Alert: Santa’s home and job are at risk if the grownups keep acting like children.

Adult Spoiler Alert: be very afraid of kids acting like adults – they might do you out of a job.

A wildfire climate-vulnerability index (WCVI) for the world

The heating of the world’s land surface since the mid-20th century has created a new landscape (atmosphere + biosphere) and specifically a new “florasphere”. The heating has changed the florasphere’s vulnerability to wildfire. The effect of the heating can be captured, and only be captured, by a new Index of Wildfire Climate-Vulnerability (WCVI); ΔHeat = ΔTemperature x ΔPeriod of heating. ΔHeat is a simple digital index which is accessible in historic weather databases worldwide, and which after a simple analysis (linear regression) of a location’s historic temperature graph, allows us to digitally link bushfire character and bushfire predictability to our experienced climate heating.

A typical WCVI calculation, for Sydney NSW. Sydney’s WCVI = ΔTemperature (vertical axis) x ΔHeating Period (horizontal axis). Heating graph data from Australian Bureau of Meteorology.

ΔHeat provides the foundation for a planning response to wildfire which accommodates climate heating. ΔHeat can become the international tool for normalising all jurisdictions’ climate history, which will permit internationally-baselined quantification of bushfire vulnerability everywhere.

ΔHeat is the quantitative proxy for climate heating in all atmospheric and biospheric systems. At its broadest, ΔHeat is simply an “atmospheric heating vulnerability index”. It has equal capacity to measure cumulative heat in (1) atmospheric systems (climate heating, bushfire prediction), (2) ocean systems (marine heatwaves, icecap-water dynamics), and (3) biospheric systems (eg species evolution, species vulnerability). ΔHeat has been employed to map Australia’s climate heating regime (Laing, separate post): Stage 1 cooling (pre-1956) then Stage 2 heating (1956 – present).

Climate change is an extraordinary emergency

Australia, along with the rest of the world, has had the last five years to make up our mind whether climate change is an emergency.

Around the world to date (December 2020), 1,849 jurisdictions – Governments at national, state and local level –  in 33 countries have declared a climate emergency. This represents 820 million citizens; 10.5% of the world, or around 15% of the world’s adults. It includes 90% of Britain and 75% of New Zealand. In Australia close to 100 jurisdictions representing 9 million people, or 35% of our population, have declared a climate emergency. Last year 300,000 adults and schoolchildren – over 1% of Australians – went on strike, in the middle of a working Friday, to express their plea for action on climate change and to express their anger at the Australian Government for their failure to act on climate change. Last year a historic petition of 404,538 people – nearly 2% of Australians – called on the Australian Parliament to take urgent action on climate change.

So how has this overwhelming mass sentiment been absorbed and digested by its target, the Australian Government, since then? On 2 December 2020 the Australian Government, along with our alternative government the Australian Labor Party, voted against declaring a climate emergency. Yet again – revisiting groundhog day 15 October 2019.

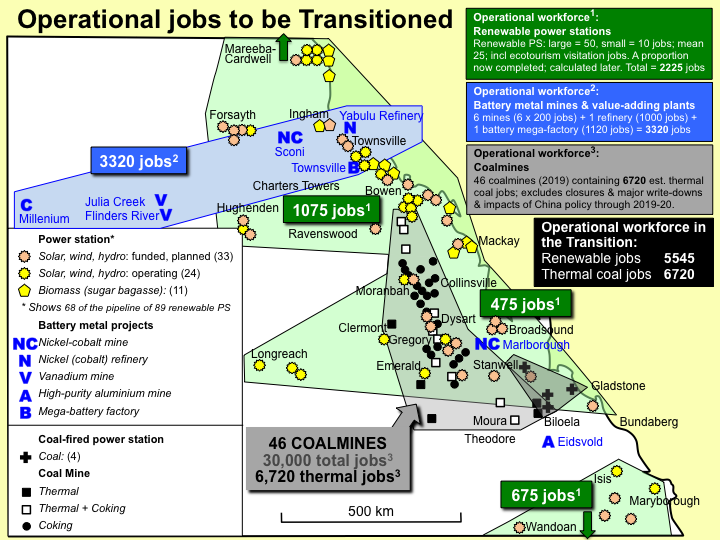
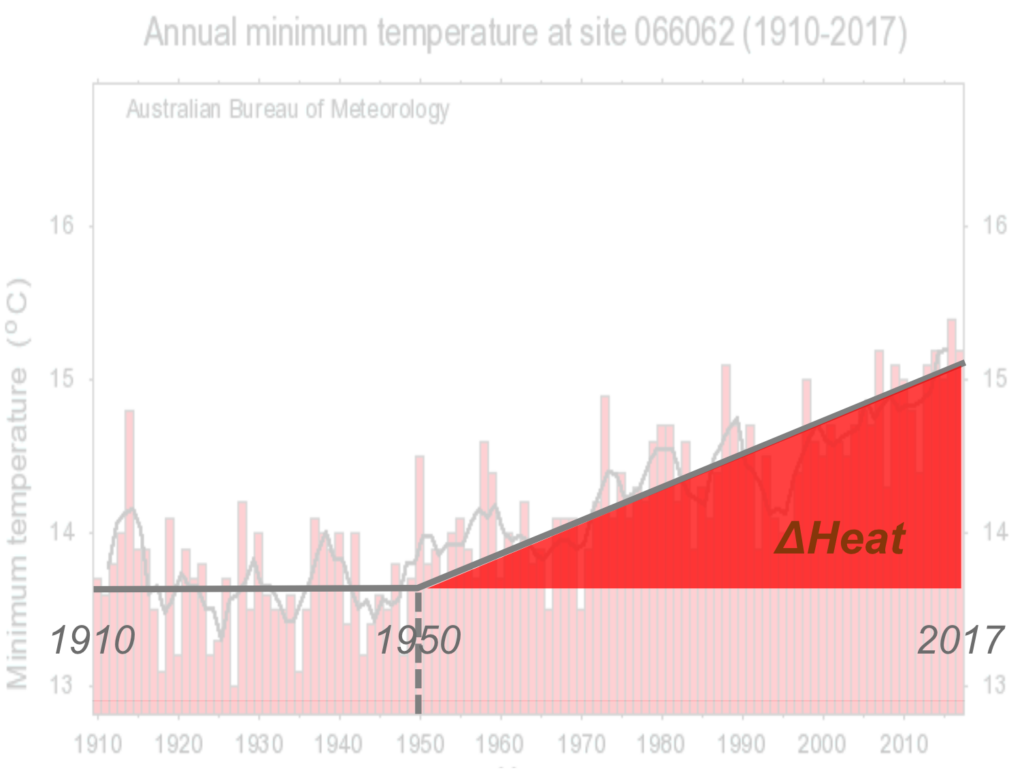
As a climate scientist who has just produced a comprehensive analysis of Australia’s climate since 1856 (see separate post), I have unearthed a bunch of facts. They are not interpretations or assumptions or the will of God. Australia is heating at a rate of 2.4 degrees per century (DPC). This is double the world rate. Seven towns around our nation have been heating at 4 DPC or more for the past 60 years (post-1956 mean): Longreach (fastest heating at 5.3 DPC; one degree every 19 years), Bowen, Camooweal, Wagga, Boulia, Charleville, and Rockhampton (4.0 DPC). The same central Queensland region is also the fastest-cooling region in the cooling stage which preceded Australia’s current strong heating stage (pre-1956 mean): Camooweal (fastest cooling at -8.6 DPC), Thargomindah, Bowen, Burketown, Normanton, and Longreach (the slowest of the fast-cooling at -1.6 DPC). Albeit currently unexplained, these regional climate behaviours are not accidental; they are indisputable, highly potent, regional events.

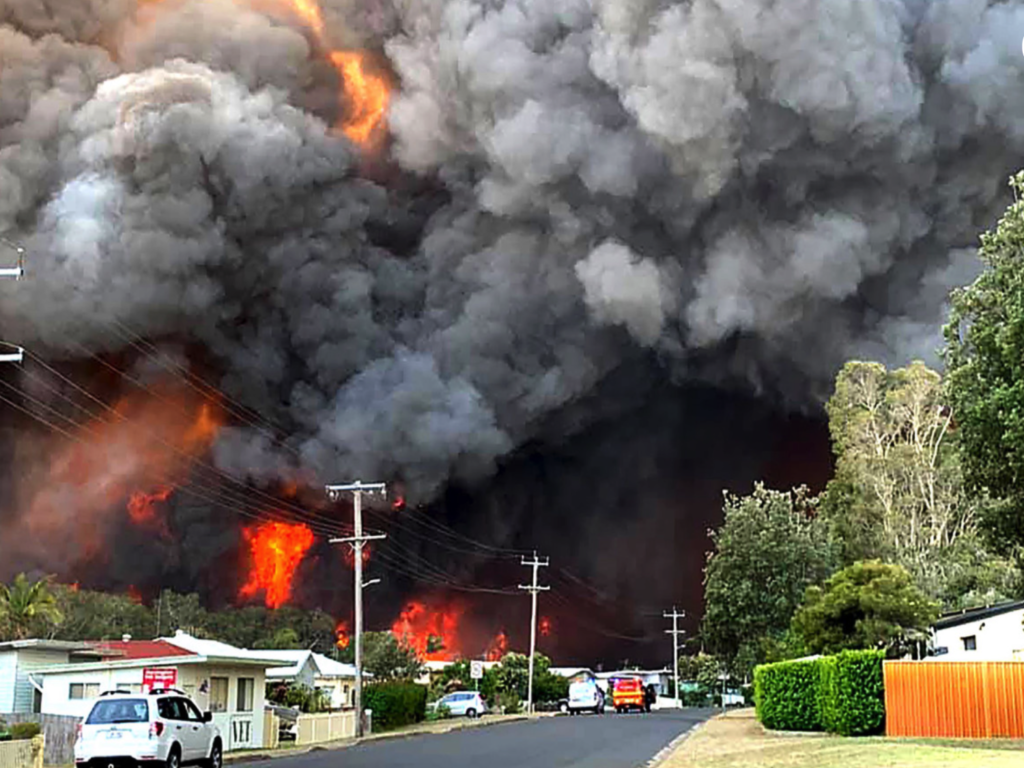
So what are our elected Australian decision-makers doing, to in response to (a) Australia’s climate science facts, and (b) the science-informed will of their Australian constituents? I write this paper in the hope that someone will present and argue it to our political masters. I write as a Queenslander, to make the point that Australians in their home town face an emergency; this is not some international shadow or national cloud which may or may not affect me. It has already affected me by heating my region (the Bowen region) 2 degrees since I was born, and it will go on heating my kids’ and my grandkids’ days and nights until either someone listens, or the world becomes catastrophe. Climate change is not just an emergency. Climate change is an extraordinary emergency.

Australia’s climate change: A new empirical model

A new empirical study of Australia’s minimum temperature climate regime since the start of records at 1910 reveals a two stage history: a cooling or neutral temperature stage, followed abruptly at circa 1955 by linear heating to the present at a transcontinental mean of 2.4 degrees per century (DPC). This history is consistent in Australia’s suite of over one hundred internationally-accredited highest-quality ACORN-SAT weather stations. A significant proportion of Australia is heating at over 3 DPC.

The study has a larger outcome: it reveals a new reality in the global and two hemispheric heating graphs. Their heating history, from their still-valid startdate of circa 1917, is segmented, into several consecutive events. In contrast, their mean “linear regression line” to the present is artificial, does not represent a discrete single event, and its mean value (nominated by IPCC and others as 1-1.1 DPC) is relatively meaningless.

Each of the planetary-scale climate regimes contains a significant cooling event in the middle of the 20th century. This “V curve” topology inherently delivers a mean artificial heating rate under the “linear regression” alluded to above (“1-1.1 DPC”) which is substantially lower than its component real heating event(s). The current real heating rate in each regime is manifest only in the last segment of each graph, which is inherently steeper – faster – than the “mean” heating rate. Segmented linear analysis of the global, hemispheric, and Australian heating graphs reveals the following current mean temperature heating rates: global 2.1 DPC, northern hemisphere 2.6 DPC, southern hemisphere 0.93 DPC, and Australia 1.6 DPC (mean temperature) and 2.4 DPC (minimum temperature}.

The world is heating at a rate substantially faster than the mantra rate of 1-1.1 DPC, which needs to be discarded.